
www.ularkin.org. This information is publicly available and updated annually.
The on-time graduation rate is calculated taking into account all students that were supposed to graduate in the specific academic year at the time they enrolled at LU. This means the percentage of students that did not graduate on time could have either left the program earlier for personal reasons, have been dismissed from the program or might be still continuing the program aiming for graduation in the program specific maximum allowed time.

The threshold of acceptability for this measure is 76% for LU as a whole and for the individual ethnicity groups. This threshold of concern have been identified by LU Administration taking into account literature research published for health professions and individual ethnic groups and the criteria set forth by the Accreditation Council for Pharmacy Education. Hereby LU takes into account the demographics of its student population and results from peer institutions. Should the University on-time graduation rate go below the threshold of acceptability, the institution will first gather and analyze information by conducting a detailed analysis of the respective cohort with the graduation rate lower than 76%. This would include a root-cause analysis of the respective program(s). Using the data from the analysis, the institution will identify key areas for improvement such as possible student groups or degree programs in which students are not graduating and instruct the Colleges responsible for the respective programs to present an action plan for improvement. The College will also review outcomes assessment data for those cohort years and identified programs to determine possible improvements in student learning outcomes. This analysis would also include review of internal policies, processes, and suggested pathways that may have an adverse effect on graduation rates. Based on the findings of the analysis, the institution will focus on implementing and measuring institutional changes aimed at increasing student achievement measures.
2023 Graduation Rates for the College of Pharmacy*
| Year | On time | +1 year | Overall |
| 2019 | 72.5% | 90.3% | 90.3% |
| 2020 | 81.4% | 90.1% | 93.8% |
| 2021 | 85.5% | 90.8% | 90.8% |
| 2022 | 88.4% | 92.3% | 92.3% |
| 2023 | 82.0% | TBD | TBD |
* Graduation rates are reported from the beginning of fall semester to the end of the next year’s summer semester (The typical academic year).
As the on-time graduation data does not differentiate between students that never finished the program and students that graduated from the selected program later, but within the allowed timeframe, LU tries to identify the percentage of students that actually did achieve their degree. Larkin University identified its maximum-time graduate rates as students earning a degree within five years in the PharmD program or within 18 months within the MBS program of initial enrollment. To calculate this metric, a graduation cohort of students must be defined: The 2016 graduation cohort includes all students that enrolled in the MBS program in 2016 and were supposed to graduate in 2017, but might have done so either in 2017 or 2018, and the Pharmacy students that enrolled in the program in Fall 2016 and either graduated in 2019 or in 2020.

The threshold of acceptability for this measure is 80%, for the whole University and 75% for the specific ethnic groups. This thresholds of concern have been identified by LU Administration taking into account literature research published for health professions and individual ethnic groups. Should the University on-time graduation rate go below the threshold of acceptability, the institution will first gather and analyze information by conducting a detailed analysis of the respective cohort with the graduation rate lower than 80%. This would include a root-cause analysis of the respective program(s). Using the data from the analysis, the institution will identify key areas for improvement such as possible student groups or degree programs in which students are not graduating and instruct the Colleges responsible for the respective programs to present an action plan for improvement. The College will also review outcomes assessment data for those cohort years and identified programs to determine possible improvements in student learning outcomes. This analysis would also include review of internal policies, processes, and suggested pathways that may have an adverse effect on graduation rates. Based on the findings of the analysis, the institution will focus on implementing and measuring institutional changes aimed at increasing student achievement measures. So far the University never got close to this threshold of concern.
Fall-to-Fall retention rates are calculated for the College of Pharmacy only, as the College of Biomedical Sciences only has a one-year program. For programmatic accreditation in Pharmacy Larkin University determines the basis for meeting enrollment and retention goals by using the definitions as determined by the Accreditation Council for Pharmacy Education’s (ACPE) guidelines which state that the thresholds of concern are identified as, “the number of academic dismissals is greater than or equal to six percent of the, matriculating class size. The number of students withdrawing from the program is greater than or equal to six percent of the matriculating class size. The number of students with a delayed graduation is greater than or equal to fifteen percent of the matriculating class size. The total attrition related to on-time graduation is greater than or equal to twenty four percent of the matriculating class size. For this purpose, attrition is the total number of students who did not graduate on time for any reason, including delayed graduation, academic dismissal, or withdrawal from the program.” Progression of students in the Doctor of Pharmacy program has improved each year since 2019 and currently indicates that there are no areas which meet the threshold of concern as noted by ACPE. Fall-to-Fall retention rates for Larkin University have a determined threshold of acceptability of 85%, which has been identified by LU Administration as a number that a) allows the College of Pharmacy to meet the criteria for reporting as required for programmatic accreditation and b) account for variance in the respective academic years.

Should COP Fall-to-Fall Retention Rate fall below the threshold of acceptability, the institution will first gather and analyze information by conducting a detailed a root-cause analysis of the cohort. Using the data from the analysis, the institution will identify key areas for improvement. COP would also also review outcomes assessment data for those cohort years and determine possible improvements in student learning outcomes. This analysis will also include review of internal policies, processes, and suggested pathways that may have an adverse effect on retention rates. Based on the findings of the analysis, the institution will focus on implementing and measuring institutional changes aimed at increasing student achievement measures. Since there is a one-year delay in measuring Fall-to-Fall Retention Rates, this process would continue until the PharmD program has two consecutive cohorts with Fall-to-Fall Retention Rates above 85%.
Larkin University supports the educational needs of a diverse student body and is proud that our student body diversity reflects the vibrancy of South Florida. Pursuing their education at LU provides our students with many opportunities to learn within a community of people from a variety of backgrounds and experiences. The identified measures of student achievement support the University’s focus of preparing students to enter the pharmacy profession, join health sciences related industrial or academic research or to continue their education to become a health professional. Although the metrics the University uses in measuring student achievement are institutional level metrics, the University is committed to the success of all of its students and assesses aggregated data as well as disaggregated data by program, ethnicity, or gender. Larkin University considers as optimal if none of the identified ethic groups/races would have more than 60% with a threshold of acceptability for this measure of 70%. Should one group go above the threshold of acceptability, the President’s Council will gather with Admissions, the Dean’s council and Marketing to do a root-cause analysis and re-asses the recruitment plan and the public-relations strategy of the University. In the next step the University would implement data-driven changes in the recruitment and public relations strategy. The picture below shows the current student demographics:
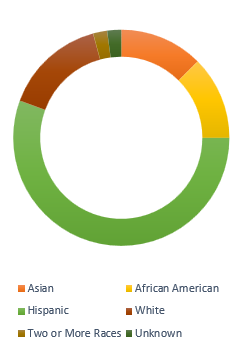
These key pieces of student demographic data inform the University student achievement measures, thresholds of acceptability, and achievement goals. In addition to student demographics, Larkin University determined enrollment goals for its colleges based on strategic planning including budget forecasting, campus and facilities development, hiring strategy and faculty/student ratio.

Larkin University determined enrollment goals for its colleges based on strategic planning including budget forecasting, campus and facilities development, hiring strategy and faculty/student ratio.
Placement data for the Larkin University College of Biomedical Sciences MBS Placement Data: A key component of student achievement within the MBS program is following graduation, for students to be employed in a healthcare field and/or be prepared to apply to a health professions school. The monitoring of graduation rates of the MBS program as well as the placement outcomes serves as a benchmark to determine the success of the program. The Florida Department of Education requires a 60% placement rate for program graduates and its Commission of Independent Education reports an an average of 75% for the last three year, which has been identified by LU as the threshold of concern for the programs offered at LU. The COBS Graduation Placement data utilized, records the number of graduates for each year since 2017. The data points on the chart capture the number of students who are accepted into health professions school, employed in a healthcare field, employed in a research field or are in the process of applying to health professions school. The program has graduated 27 students since 2017. As of October 2020, 15% of the graduates are currently in health professions school, 31% are currently working in healthcare, 15% are currently working in research and 26% are in the application cycle for health professions school. Based upon this data, the MBS program has a 93% placement rate, which we are very proud to have achieved together with our students.
Placement data for the Larkin University College of Pharmacy DOP:
NAPLEX pass rate (1st attempt) Data reported by NABP each January
Class of 2019 = 60.5%
Class of 2020 = 57.4%
Class of 2021 = 66.7%
Class of 2022 = 66.0%
Class of 2023 = 54.1%
| Tested within 60 days of graduation | Larkin University COP | State of Florida | National |
| 2019-2023 | 81.8% | 92.4% | 93.5% |
Placement Rates*